Indeed.com tech job trends from 7/2015 to 7/2016
A few years ago out of curiosity I started recording counts of the number of jobs on indeed.com every week for specific tech keywords in specific metropolitan areas. The original motivation for doing this was to spot software development job trends relevant to my interests to try to gauge the relative popularity or popularity trends of specific technologies for cities across the U.S.
After a few weeks of manually recording these numbers in a spreadsheet I realized I could write a program to do this a lot faster and for more keywords and more cities. I wrote a small C# program to loop over a few keywords and a whole bunch of cities. Here are the cities and here are the keywords I used. I ran searches for both 25 and 50 mile distances within the selected city.
I ran it somewhat sporadically since once I wrote the program to automate this task I, of course, lost interest in the data or the prospect of eventually doing anything with it. When cleaning up some files I accidentally deleted a few months of recorded data (oops), however in July 2015 I set up a scheduled task to run it consistently every week so that given time I might have enough accumulated data to eventually play with it.
Now that July 2016 has ended a little over a year has passed so I thought I might take a look at it. I don’t really care about applying rigorous statistical analysis to this data – I really just want to plot it and see if anything obvious pops out.
Adding all the jobs within a 25-mile radius for all cities and keywords searched results in a disappointing -0.3% loss for the past year, starting and ending with 174,251 and 173,710 jobs respectively. I would have thought there’d be at the very least a modest net gain for tech jobs for a whole year, however this may just be because of the specific keywords I chose – they could be doing far worse than the rest of the market.
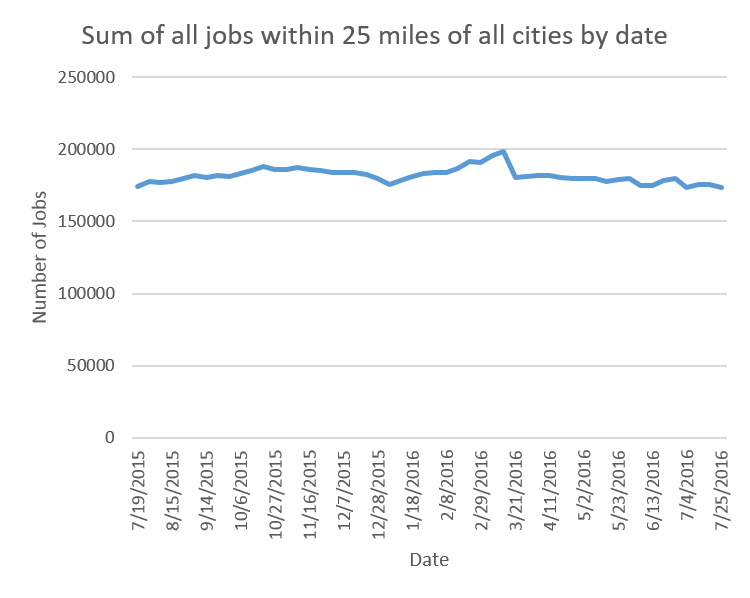
This isn’t accurate since some of the keywords overlap, resulting in counting the same job multiple times. Some of the cities I searched overlap within 25 miles of each other too. For example, many jobs between Washington D.C. and Baltimore would be counted twice here.
Despite the above caveats it’s interesting that there’s a dip at the new year (175,822 on 1/4/2016) and a peak at the beginning of March (198,214 on 3/7/2016). I wonder if this is possibly because hiring slows around the holidays and then picks up the slack in the first quarter of the new year. However, this may be noise, variations due to employers posting on indeed at some times of the year and not others, or perhaps a cull of spam/duplicate postings around Christmas and a surge of them around the end of February followed by another cull.
When breaking apart the above chart by keyword it seems the general trend of a dip at the end of the year and a peak by March holds.
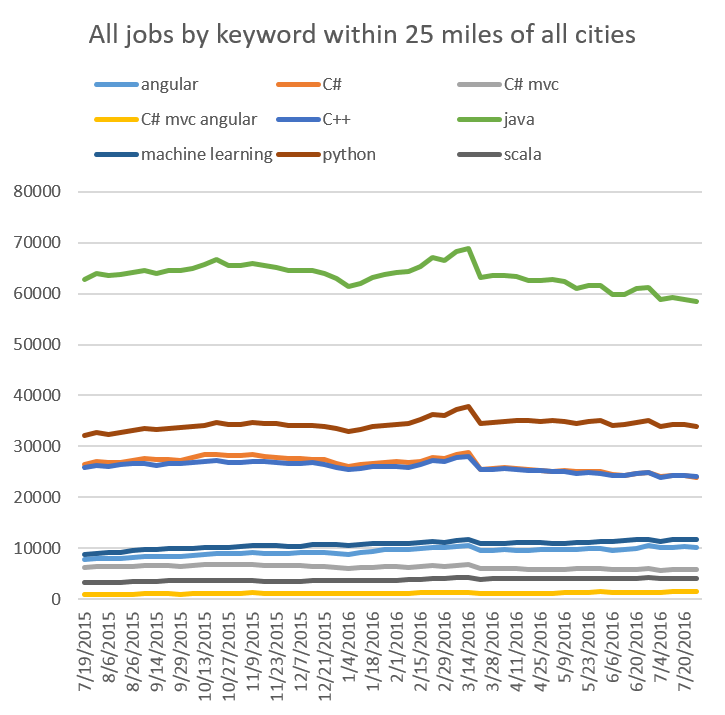
However, the total number of jobs by keyword changed over the year:
| Keyword | Postings ± | % change |
|---|---|---|
| angular | 2,429 | 31.3% |
| C# | -2,560 | -9.7% |
| C# mvc | -389 | -6.3% |
| C# mvc angular | 495 | 51.1% |
| C++ | -1,826 | -7.0% |
| java | -4,418 | -7.0% |
| machine learning | 3,019 | 34.7% |
| python | 1,876 | 5.8% |
| scala | 833 | 25.4% |
| Grand Total | -541 | -0.3% |
Across all cities these keywords have some variation between them. However, what about the jobs for specific cities?
I initially started this with simply way, way too many cities. My thinking at the time was that maybe some specific keyword was really popular in some smaller city. This doesn’t happen. The top 10-15 or so cities dominate for every keyword I searched for. To give you an idea of the distribution visually here’s a chart of all jobs within 25 miles by city. Each line represents the number of jobs for each city I searched throughout the year. I excluded the legend because it’s just simply too many cities.
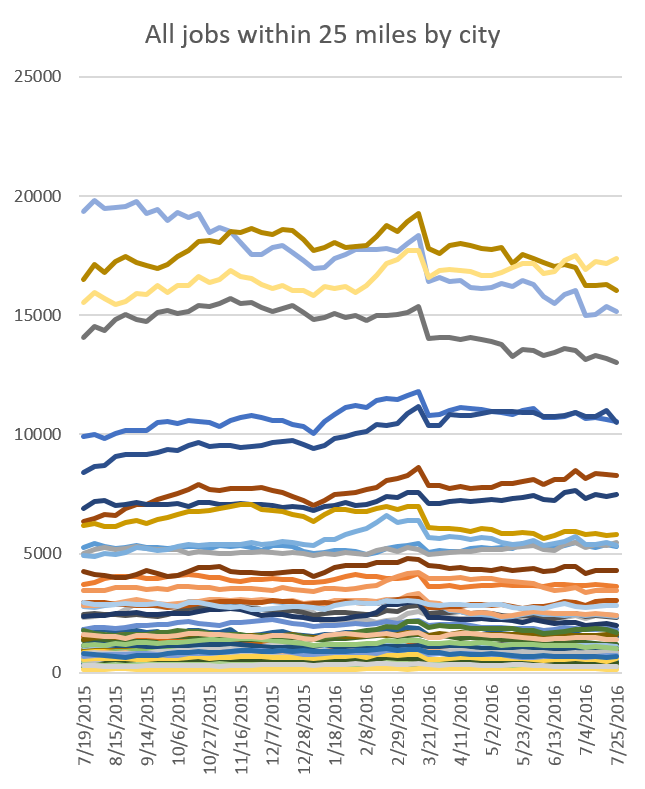
This becomes a little more readable when limited to only the top 10 cities.
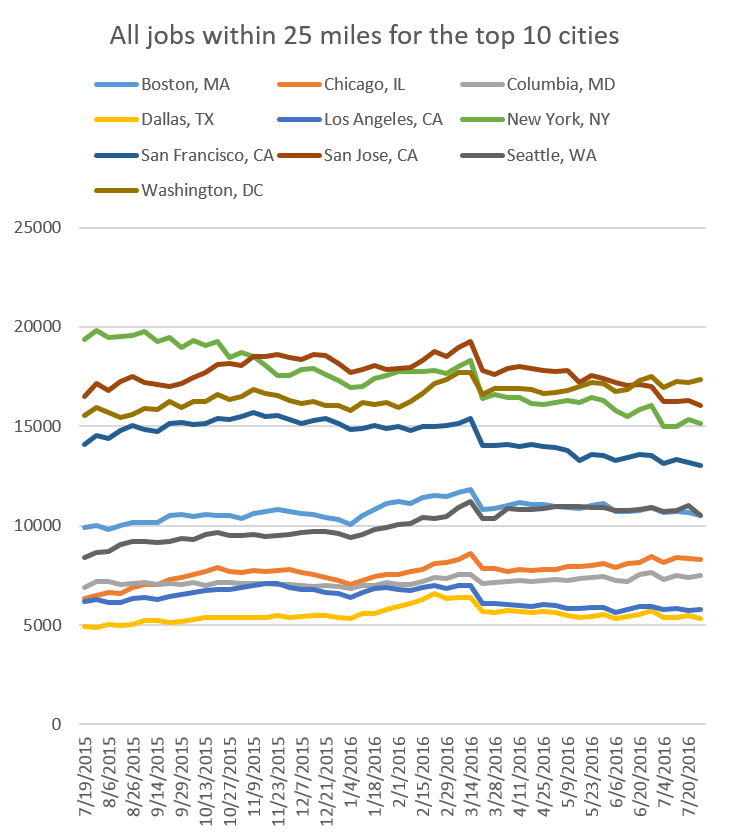
From the chart we can see New York has lost a lot of postings over the past year. San Francisco seems to have dropped too. Here are the numbers:
| City | Postings ± | % change |
|---|---|---|
| Boston, MA | 599 | 6.0% |
| Chicago, IL | 1,939 | 30.6% |
| Columbia, MD | 590 | 8.6% |
| Dallas, TX | 435 | 8.9% |
| Los Angeles, CA | -361 | -5.9% |
| New York, NY | -4,217 | -21.8% |
| San Francisco, CA | -1,040 | -7.4% |
| San Jose, CA | -479 | -2.9% |
| Seattle, WA | 2,083 | 24.8% |
| Washington, DC | 1,821 | 11.7% |
| Grand Total | 1,370 | 1.3% |
New York dropped quite a bit. San Francisco to some degree too. Seattle and Chicago had a great year and Washington, D.C. had modest growth.
I’m a little shocked New York dropped so much. Is the tech job market collapsing there? As I mentioned earlier there are problems with this data, like the overlap between the keywords I’m using. To try to eliminate this, let’s look at each city only looking at the number of Java job postings.
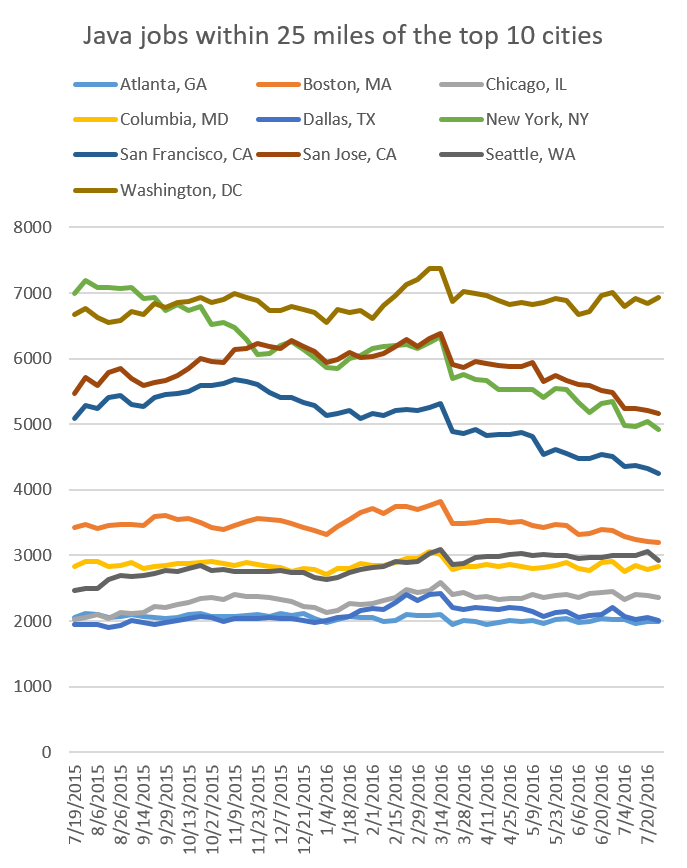
| City | Postings ± | % change |
|---|---|---|
| Atlanta, GA | -63 | -3.1% |
| Boston, MA | -231 | -6.7% |
| Chicago, IL | 326 | 16.1% |
| Columbia, MD | 8 | 0.3% |
| Dallas, TX | 54 | 2.8% |
| New York, NY | -2,069 | -29.6% |
| San Francisco, CA | -836 | -16.4% |
| San Jose, CA | -299 | -5.5% |
| Seattle, WA | 464 | 18.8% |
| Washington, DC | 259 | 3.9% |
| Grand Total | -2,387 | -6.1% |
The drops in New York and San Francisco are even more pronounced. Let’s look at each of these a little more closely.
Instead of charts I’ll just show the data.
New York by keyword (25 miles)
| Keyword | Postings ± | % change |
|---|---|---|
| angular | 83 | 9.3% |
| C# | -816 | -31.6% |
| C# mvc | -93 | -20.5% |
| C# mvc angular | 49 | 86.0% |
| C++ | -854 | -30.7% |
| java | -2,069 | -29.6% |
| machine learning | 55 | 6.1% |
| python | -544 | -13.3% |
| scala | -28 | -4.6% |
| Grand Total | -4,217 | -21.8% |
Big losses in C#, C++, Java, and Python. If you know machine learning and angular you’re still OK.
San Francisco by keyword (25 miles)
| Keyword | Postings ± | % change |
|---|---|---|
| angular | 41 | 6.1% |
| C# | -131 | -13.7% |
| C# mvc | -35 | -22.6% |
| C# mvc angular | -1 | -2.9% |
| C++ | -160 | -9.1% |
| java | -836 | -16.4% |
| machine learning | 195 | 18.4% |
| python | -188 | -5.0% |
| scala | 75 | 12.3% |
| Grand Total | -1,040 | -7.4% |
Similar story as New York, but not as bad.
Chicago by keyword (25 miles)
| Keyword | Postings ± | % change |
|---|---|---|
| angular | 334 | 100.6% |
| C# | 173 | 14.3% |
| C# mvc | 158 | 45.7% |
| C# mvc angular | 114 | 167.6% |
| C++ | 139 | 16.7% |
| java | 326 | 16.1% |
| machine learning | 203 | 67.2% |
| python | 413 | 36.5% |
| scala | 79 | 86.8% |
| Grand Total | 1,939 | 30.6% |
Seattle by keyword (25 miles)
| Keyword | Postings ± | % change |
|---|---|---|
| angular | 172 | 72.3% |
| C# | 149 | 8.6% |
| C# mvc | -4 | -1.6% |
| C# mvc angular | 2 | 4.7% |
| C++ | 320 | 20.1% |
| java | 464 | 18.8% |
| machine learning | 360 | 58.3% |
| python | 531 | 40.2% |
| scala | 89 | 61.8% |
| Grand Total | 2,083 | 24.8% |
Conclusions?
If we could trust this data, what kind of conclusions could we tentatively draw?
- Tech job postings are pretty flat across the country as a whole.
- Job postings trend down at the end of the year and spike in the first quarter.
- New York and San Francisco might be going through a contraction.
- The Chicago and Seattle tech job markets are growing.
- Within a 25-mile radius Washington D.C. has more jobs for these keywords than San Jose, New York, or San Francisco. Weird.
However, we really can’t trust this data. Any patterns and conclusions we think we might be able to draw could be completely spurious. It’s fun to look at but to review, here are some problems with this data and why we shouldn’t actually draw any conclusions from it at all:
- Jobs are counted multiple times. They’re counted multiple times because of:
- Similarity between keywords. For example, the same job could appear for “java”, “scala”, and “machine learning” if the posting contained all of those keywords.
- The geographical regions for some of the cities overlap. For example, even within a 25-mile radius some jobs will show up for all of Washington D.C., Baltimore, MD, and Columbia, MD.
- This data is only from indeed.com. It may only represent changes in the postings for this particular site. For example, any change in any keyword for any city may simply be due to how companies and recruiters in that particular part of the industry were using recruiting tools at that particular time. It’s possible that recruiters in New York as a whole tended to migrate away from indeed.com over the past year and relied more on other methods.
- The counts I recorded are for job postings and not jobs. I used a job posting as a proxy for a job every time I used the word job in this post. A single job can be posted multiple times and by multiple recruiters. Many jobs are also not posted to sites like indeed.com at all.
I am now quite sick of making charts and formatting tables in markdown. I’m very tired of thinking about where tech jobs are. The most important job is the one you have. If you’d like to play around with this data here is the file I used to prepare this post. The code used to generate that file is here.
8/4/2016 edit:
After sharing this data with a few others I realized that my chart above using Java as a proxy of the health of the job market as a whole is pretty flawed and I can do a bit better with the data that I have. I used Java as a proxy for the market as a whole not only because of its popularity and magnitude of job postings but since most of my other keywords were combinations (e.g. “C#”, “C# mvc”, “C# mvc angular”) that would result in a significant amount of overlap and bias the total results towards those keywords. However, I should’ve probably also plotted C#, Java, C++, and Python together since there probably isn’t much overlap between those keywords and it would result in less bias towards a single language.
Well, I still can. Here are the job postings within 25 miles of the top 15 cities for C#, Java, C++, and Python:
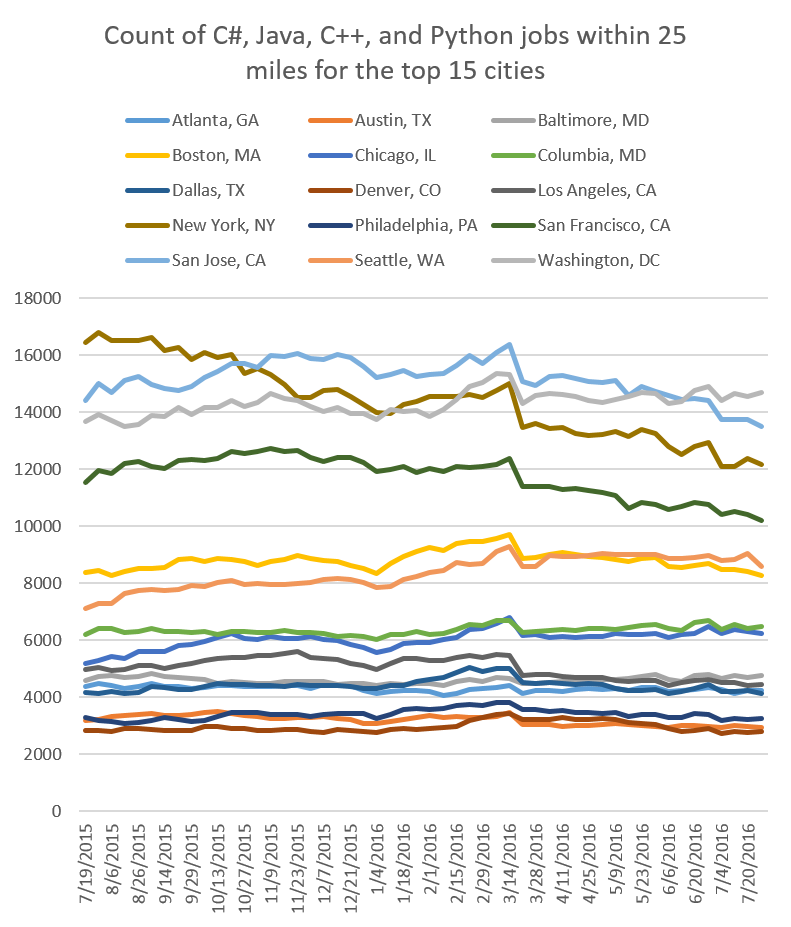
| City | Jobs Start of Year | Jobs End of Year | Change | Percent Change |
|---|---|---|---|---|
| Atlanta, GA | 4,382 | 4,235 | -147 | -3.4% |
| Austin, TX | 3,176 | 2,942 | -234 | -7.4% |
| Baltimore, MD | 4,579 | 4,781 | 202 | 4.4% |
| Boston, MA | 8,372 | 8,283 | -89 | -1.1% |
| Chicago, IL | 5,200 | 6,251 | 1,051 | 20.2% |
| Columbia, MD | 6,204 | 6,496 | 292 | 4.7% |
| Dallas, TX | 4,171 | 4,139 | -32 | -0.8% |
| Denver, CO | 2,851 | 2,794 | -57 | -2.0% |
| Los Angeles, CA | 4,981 | 4,456 | -525 | -10.5% |
| New York, NY | 16,449 | 12,166 | -4,283 | -26.0% |
| Philadelphia, PA | 3,284 | 3,259 | -25 | -0.8% |
| San Francisco, CA | 11,531 | 10,216 | -1,315 | -11.4% |
| San Jose, CA | 14,408 | 13,518 | -890 | -6.2% |
| Seattle, WA | 7,117 | 8,581 | 1,464 | 20.6% |
| Washington, DC | 13,660 | 14,699 | 1,039 | 7.6% |
| Grand Total | 110,365 | 106,816 | -3,549 | -3.2% |
And here’s within 50 miles:
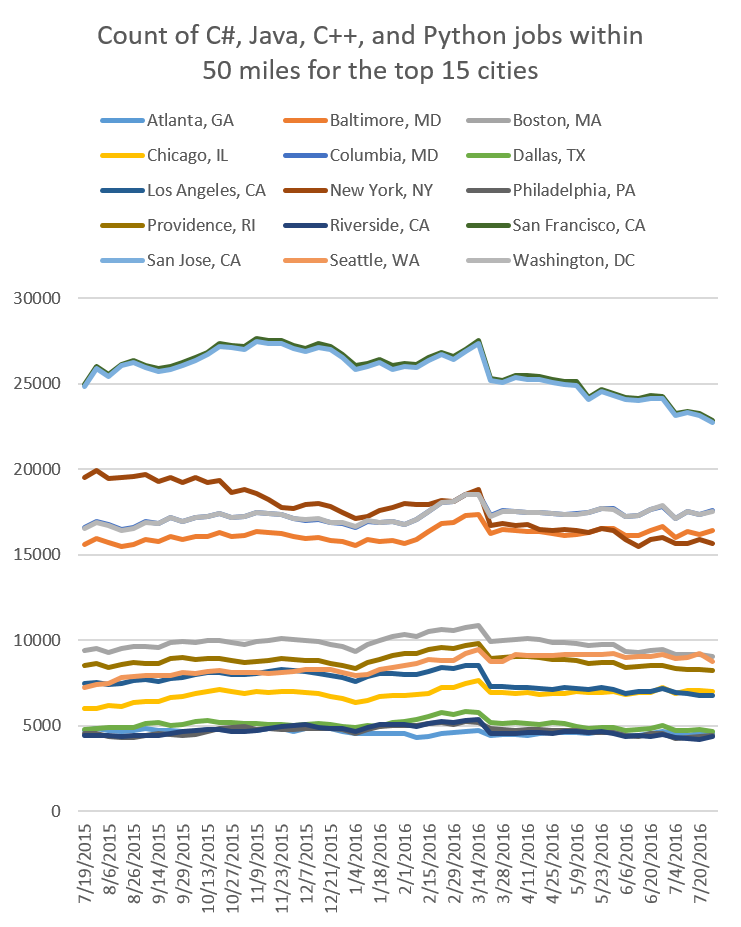
| City | Jobs Start of Year | Jobs End of Year | Change | Percent Change |
|---|---|---|---|---|
| Atlanta, GA | 4,736 | 4,556 | -180 | -3.8% |
| Baltimore, MD | 15,592 | 16,427 | 835 | 5.4% |
| Boston, MA | 9,419 | 9,038 | -381 | -4.0% |
| Chicago, IL | 5,998 | 6,987 | 989 | 16.5% |
| Columbia, MD | 16,572 | 17,568 | 996 | 6.0% |
| Dallas, TX | 4,794 | 4,659 | -135 | -2.8% |
| Los Angeles, CA | 7,453 | 6,801 | -652 | -8.7% |
| New York, NY | 19,539 | 15,642 | -3,897 | -19.9% |
| Philadelphia, PA | 4,571 | 4,418 | -153 | -3.3% |
| Providence, RI | 8,550 | 8,214 | -336 | -3.9% |
| Riverside, CA | 4,421 | 4,348 | -73 | -1.7% |
| San Francisco, CA | 24,965 | 22,850 | -2,115 | -8.5% |
| San Jose, CA | 24,854 | 22,750 | -2,104 | -8.5% |
| Seattle, WA | 7,257 | 8,752 | 1,495 | 20.6% |
| Washington, DC | 16,529 | 17,548 | 1,019 | 6.2% |
| Grand Total | 175,250 | 170,558 | -4,692 | -2.7% |
Cities very close to each other will tend to share the same number of jobs at 50 miles. For example, San Francisco and San Jose are similar because they’re so close. The same holds for Baltimore, Columbia, and Washington, D.C. D.C. was the winner for total number of jobs within 25 miles but Silicon Valley takes the lead within 50, however from this data it looks like Silicon Valley is shrinking while D.C. is growing. If the trend holds it won’t be long before D.C. overtakes Silicon Valley even within 50 miles.
Future work
If I continue to do this I think I should include more keywords to get a broader view of how things are doing. For example, include other big languages like PHP, JavaScript, Ruby, Objective-C, and Swift. It might be neat to play off Android vs. iOS too.